
El US SPX 500 Index ha atravesado el soporte
El US SPX 500 Index atravesó una línea de soporte. Ha entrado en contacto con esta línea por lo menos dos veces en 2 días. Esta ruptura puede indicar un movimiento potencial a 3952.2705 en 5 horas. Como ya vimos un retroceso de esta posición en el pasado, debemos esperar la confirmación de la ruptura […]
El US Small Cap 2000 Index se aproxima a la resistencia de un Cuña ascendente
El US Small Cap 2000 Index se está acercando a la línea de resistencia de un Cuña ascendente. Ha llegado a esta línea en numerosas ocasiones durante los últimos 8 días. Si vuelve a probarla de nuevo, debería hacerlo en las próximas 11 horas.
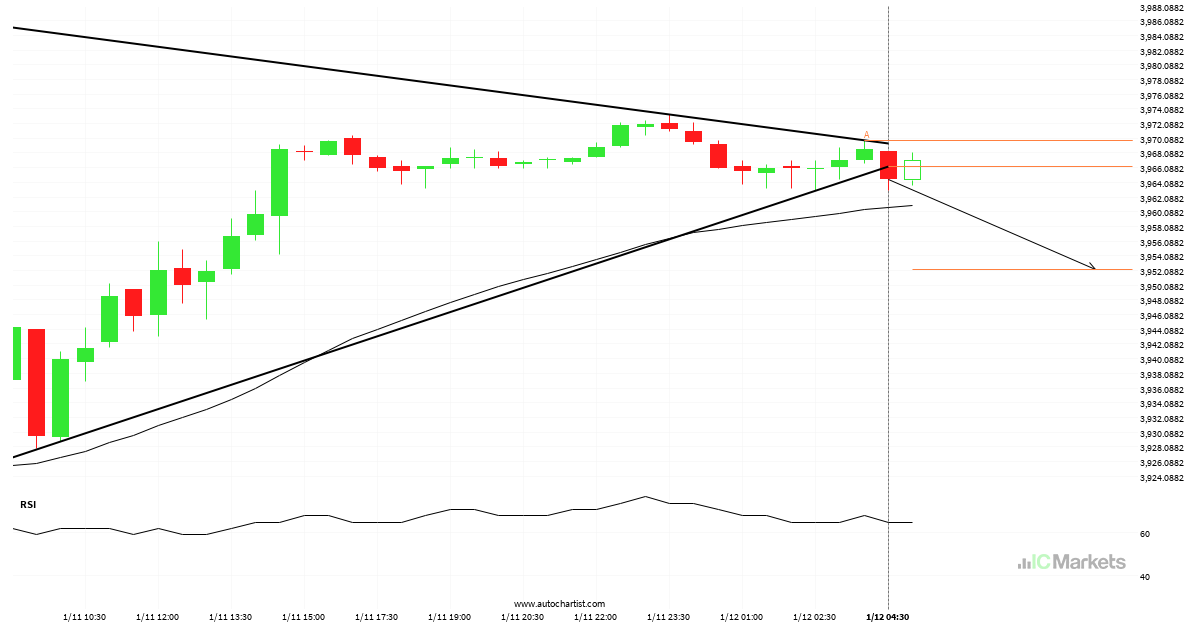
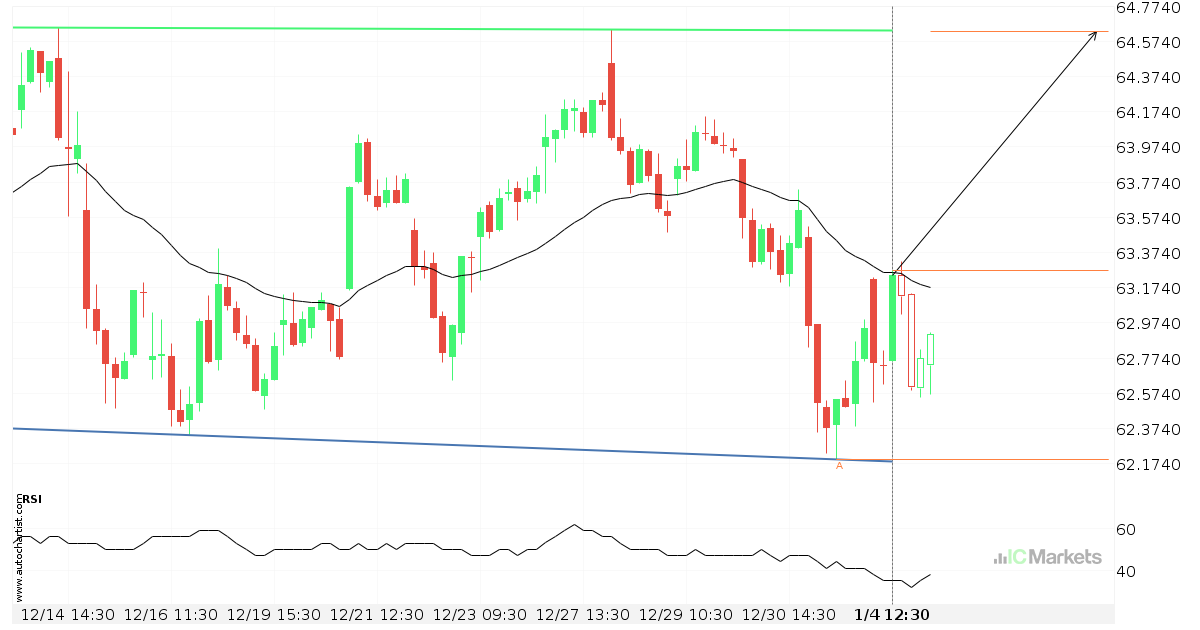
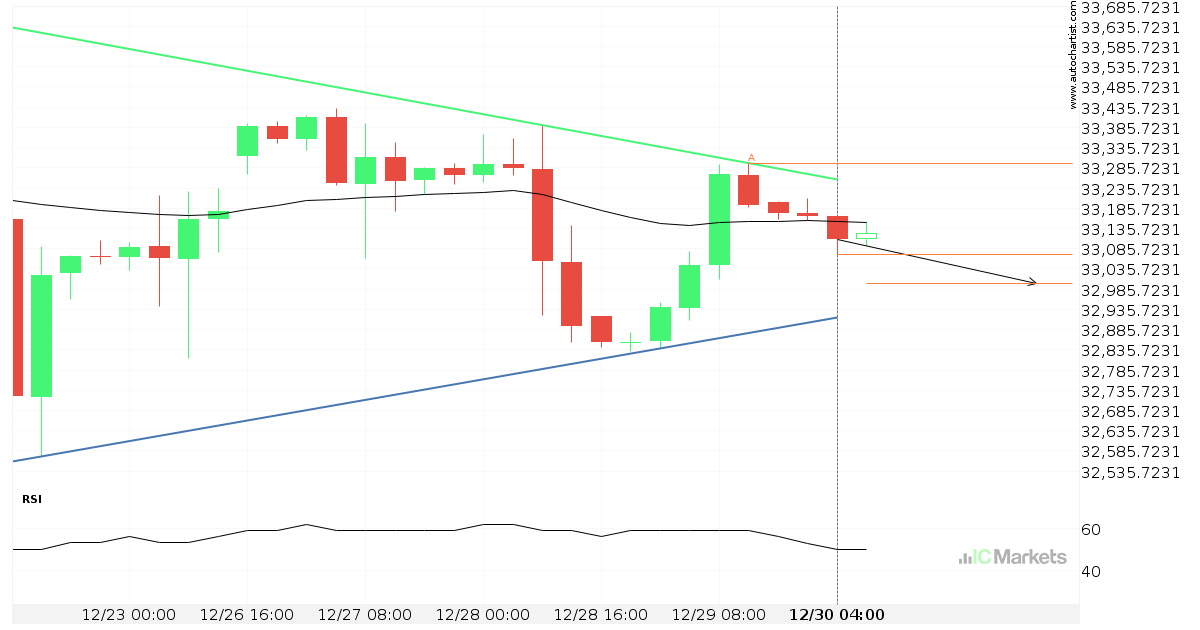
¿Tendrá el US Wall Street 30 Index suficiente impulso como para irrumpir el soporte?
El US Wall Street 30 Index se dirige hacia la línea de soporte de un Cuña descendente y puede alcanzar este punto en las próximas 6 horas. Ha probado esta línea ya en numerosas ocasiones en el pasado, y esta vez no tendría porqué ser diferente y terminar con una recuperación en lugar de una […]
Coca-Cola Co. – se acerca a la línea de precio psicológico
El Coca-Cola Co. avanza hacia la línea de resistencia de un Resistencia. Como lo hemos observado retrocediendo desde este nivel en el pasado, podríamos observar, o bien una ruptura a través de esta línea o una recuperación de nuevo a los niveles actuales. Ya ha llegado a dicha línea en numerosas ocasiones durante los últimos […]
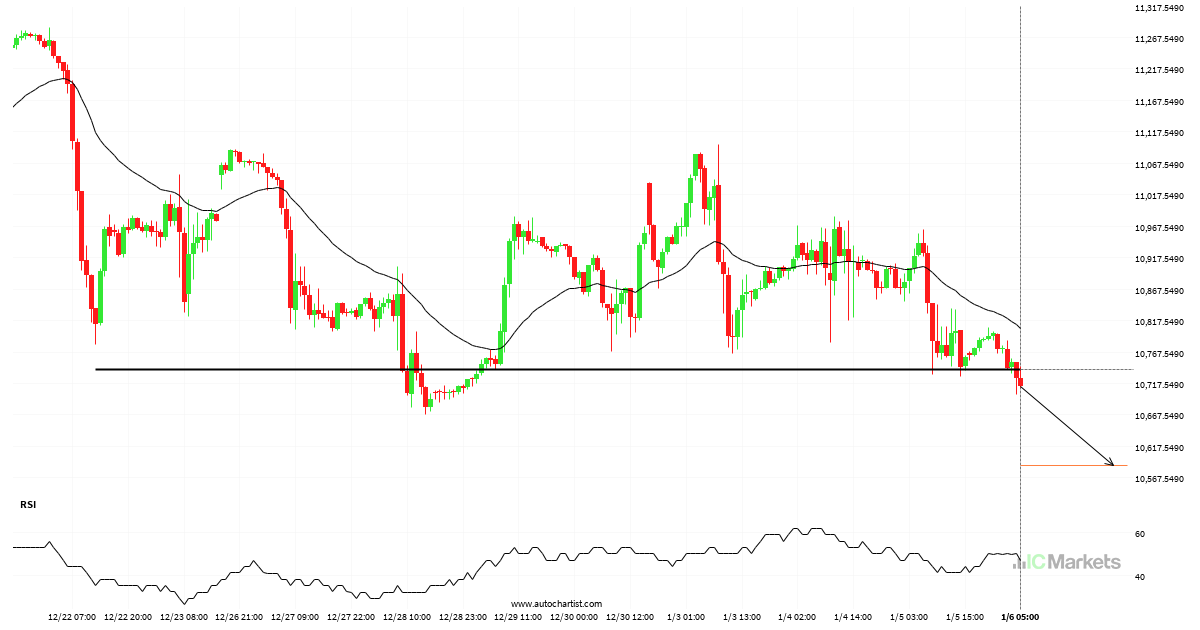
Posible gran movimiento en el US Tech 100 Index
El US Tech 100 Index ha atravesado la línea de 10740.4004, lo cual sugiere un posible movimiento en el nivel de 10587.8203 en las próximas 3 días. Ya ha probado esta línea en numerosas ocasiones durante el pasado, por lo que sería mejor esperar la confirmación de esta ruptura antes de llevar a cabo cualquier […]
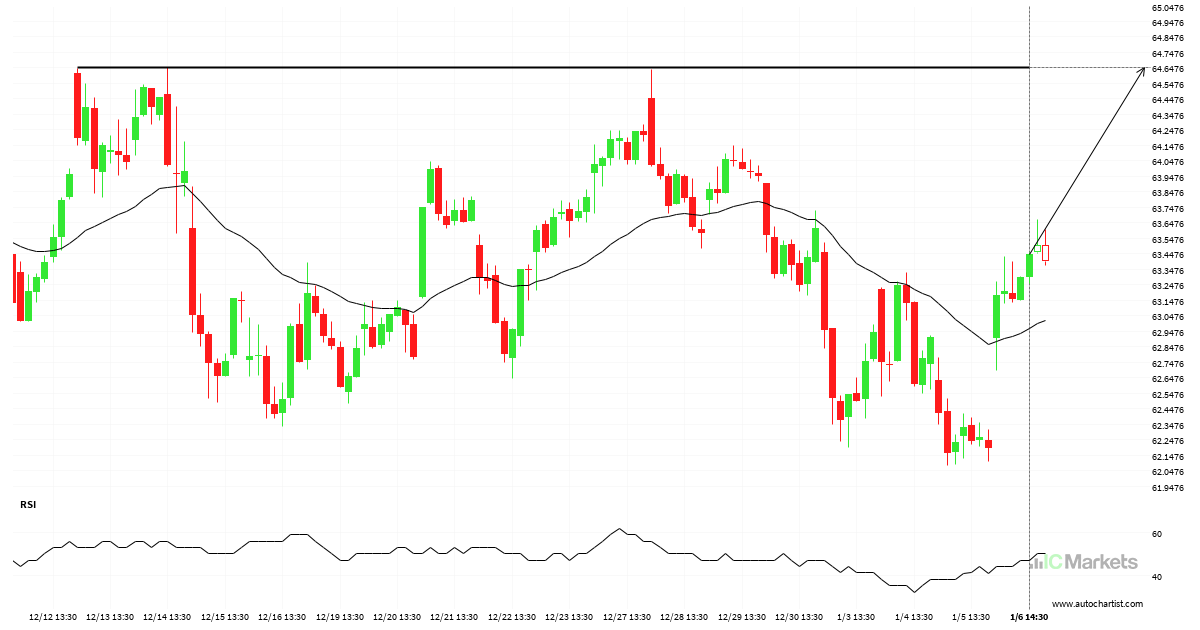
El Coca-Cola Co. se aproxima a la resistencia de un Rectángulo
El Coca-Cola Co. se está acercando a la línea de resistencia de un Rectángulo. Ha llegado a esta línea en numerosas ocasiones durante los últimos 24 días. Si vuelve a probarla de nuevo, debería hacerlo en las próximas 2 días.
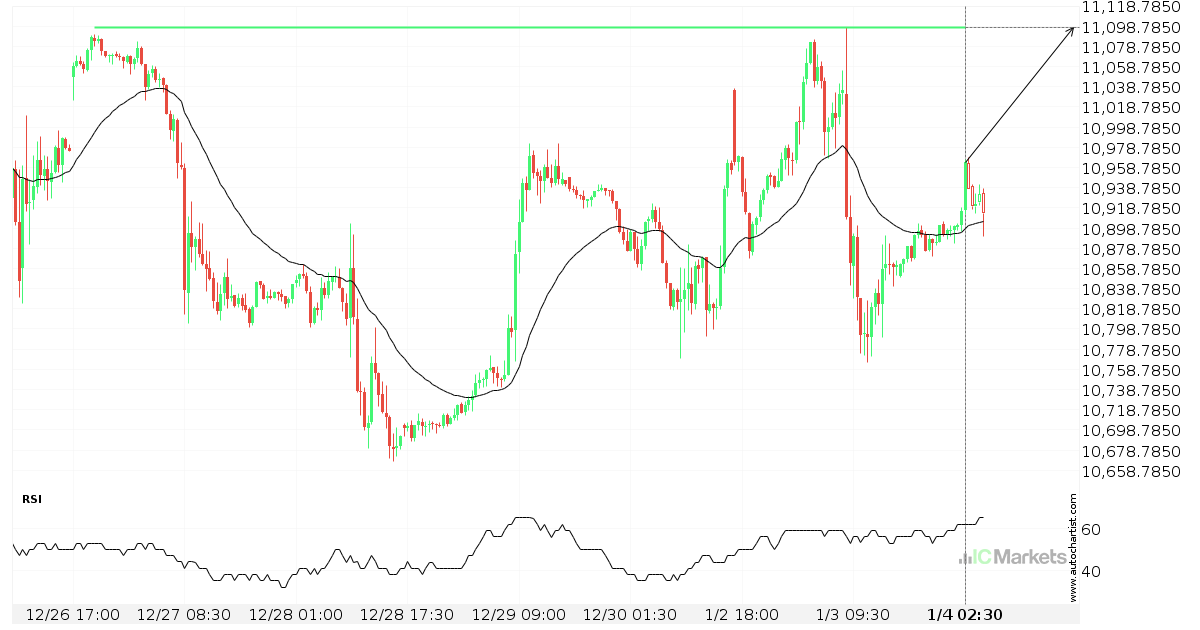
Inminente irrupción de una importante línea de precio del US Tech 100 Index
El US Tech 100 Index avanza hacia la línea de 11097.2998, que ya ha probado en numerosas ocasiones durante el pasado. Hemos observado un retroceso desde esta posición en el pasado, por lo que en esta fase no está claro si atravesará este precio o se recuperará como ya hizo antes. Si el US Tech […]
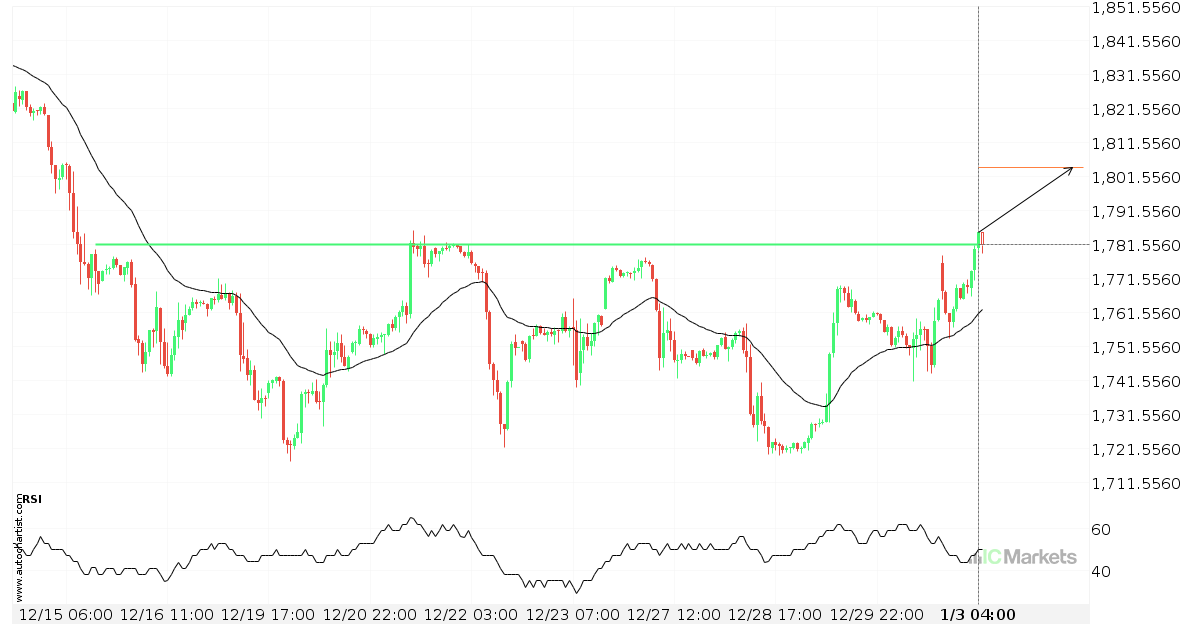
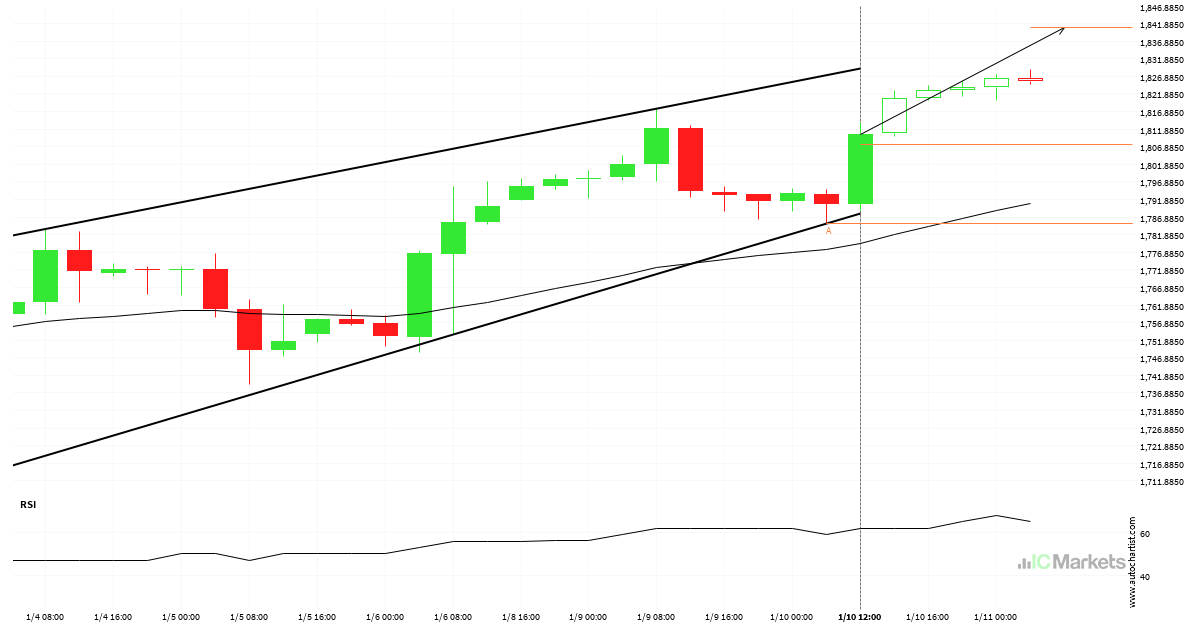
Importante línea de precio atravesada por el US Small Cap 2000 Index
El US Small Cap 2000 Index ha atravesado 1781.6700, que ha probado ya varias veces en el pasado. Ya hemos visto un retroceso de esta posición en numerosas ocasiones. Si esta nueva tendencia persiste, US Small Cap 2000 Index podría dirigirse al nivel 1804.1851 dentro de las próximas 3 días.
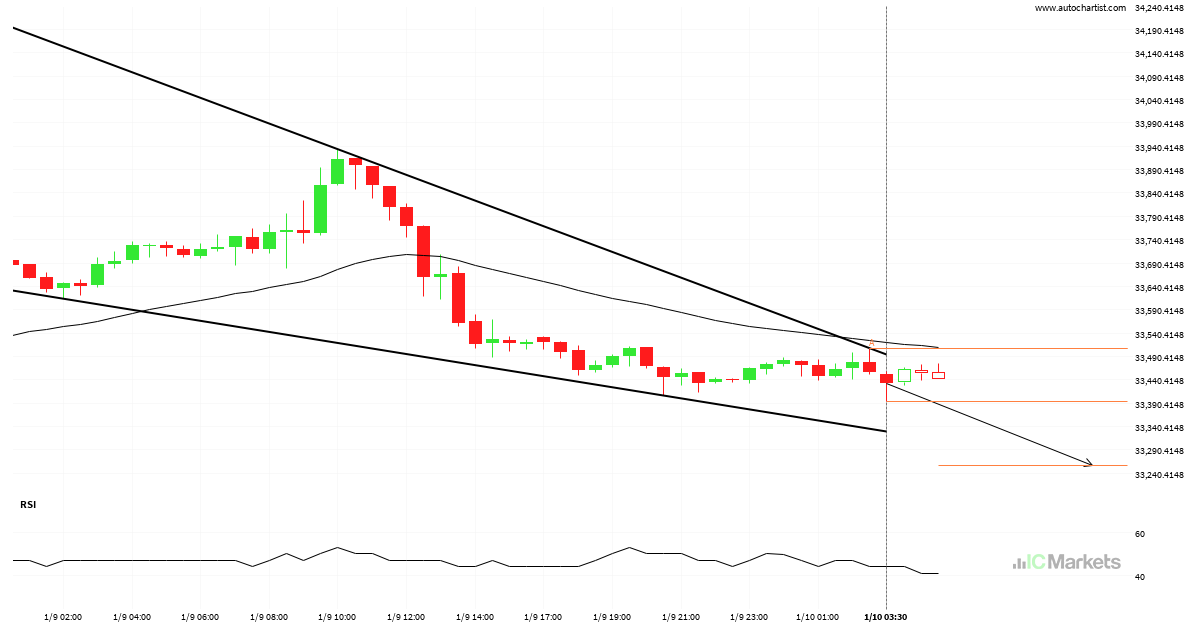
¿Tendrá el US Wall Street 30 Index suficiente impulso como para irrumpir el soporte?
El US Wall Street 30 Index se dirige hacia la línea de soporte de un Triángulo y puede alcanzar este punto en las próximas 2 días. Ha probado esta línea ya en numerosas ocasiones en el pasado, y esta vez no tendría porqué ser diferente y terminar con una recuperación en lugar de una irrupción. […]
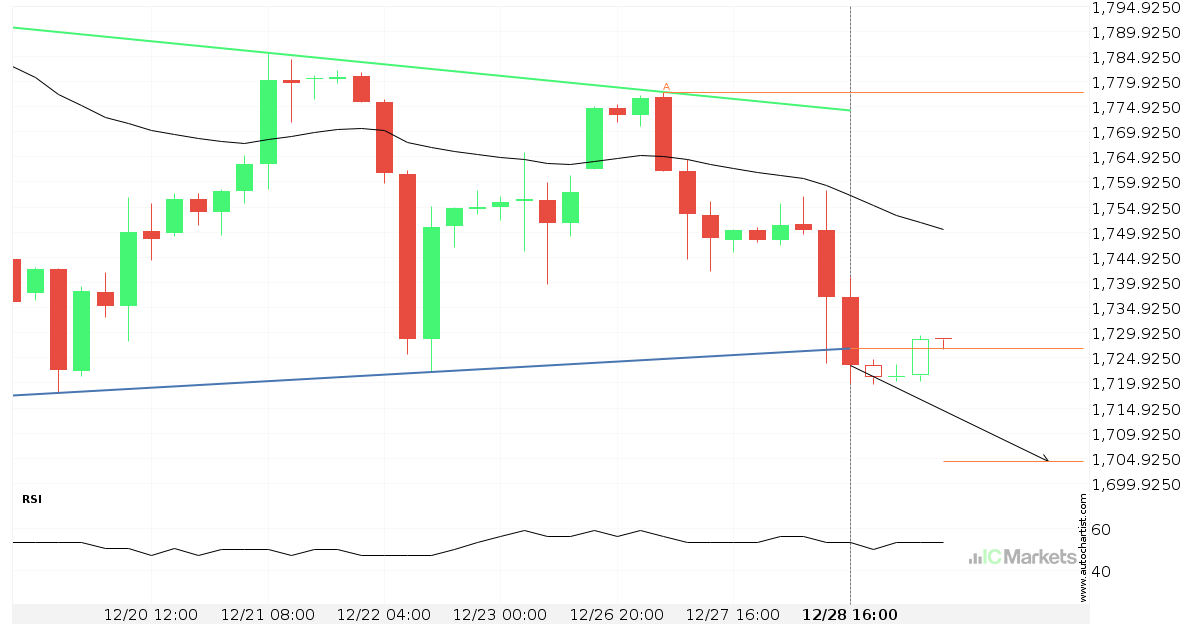
El US Small Cap 2000 Index ha atravesado el soporte
El US Small Cap 2000 Index atravesó una línea de soporte. Ha entrado en contacto con esta línea por lo menos dos veces en 10 días. Esta ruptura puede indicar un movimiento potencial a 1704.3230 en 2 días. Como ya vimos un retroceso de esta posición en el pasado, debemos esperar la confirmación de la […]